Signal flow diagram software
Signal flow diagrams for audio, video and live production
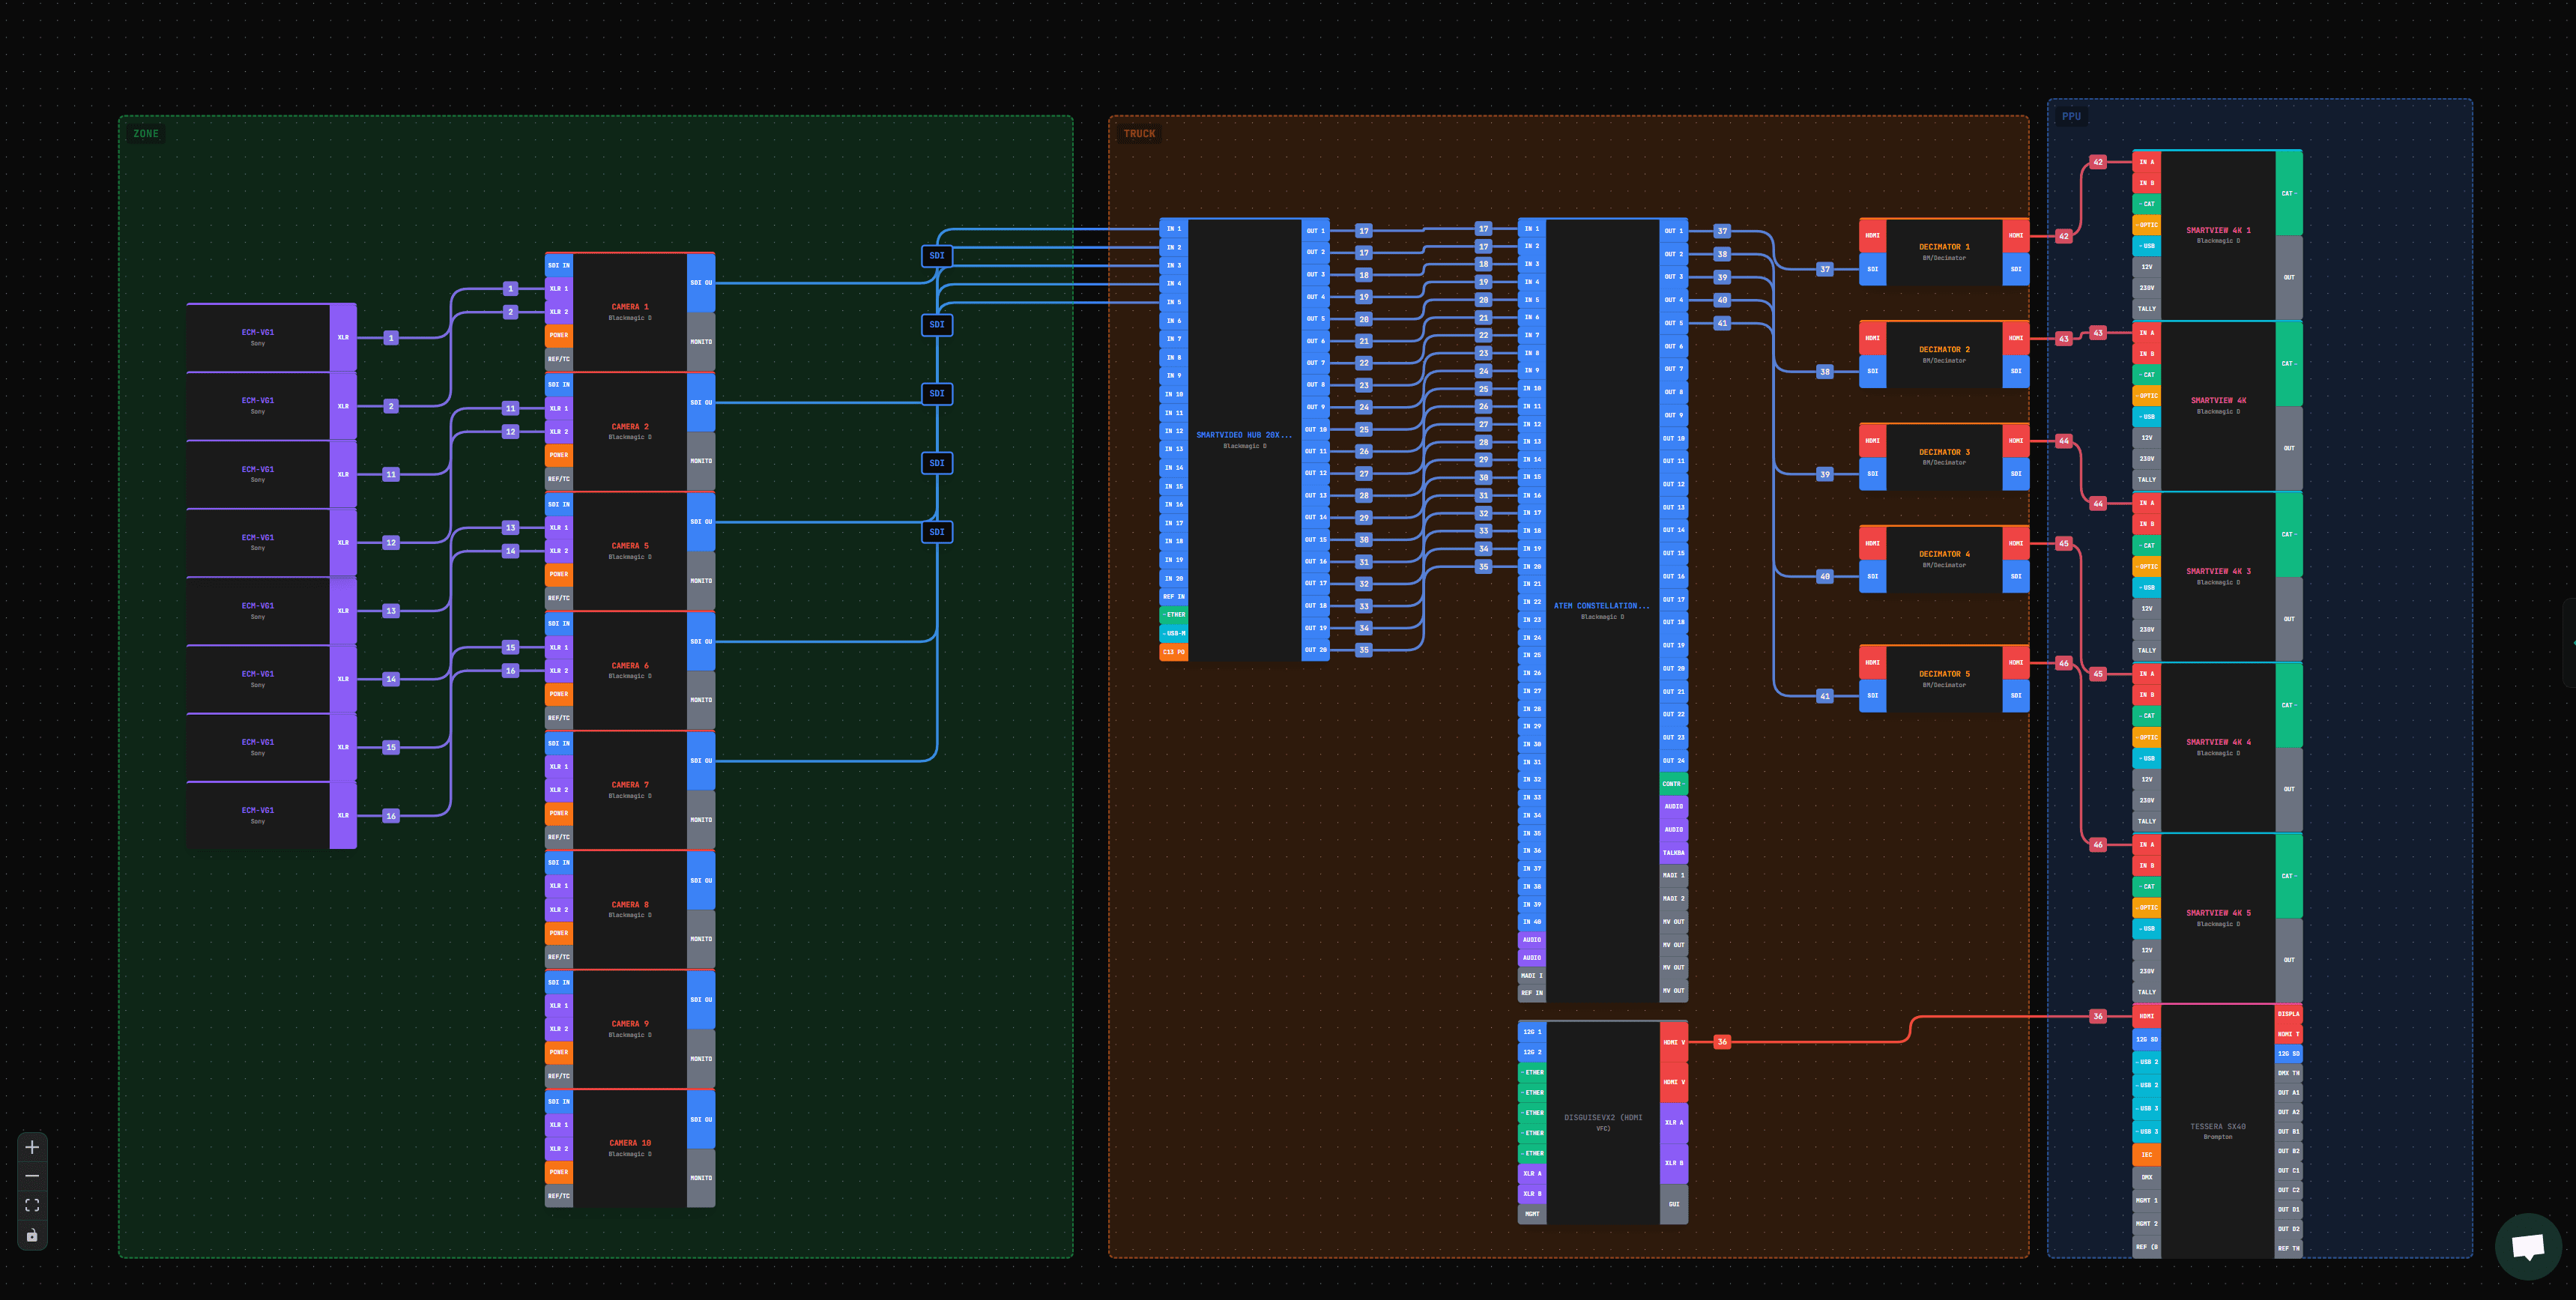
A signal flow diagram shows where every signal starts, what it passes through and where it ends. In Patchify each device has its real inputs and outputs, so a line on the drawing is a cable between two named ports, and the diagram can be checked and turned into a cable schedule.
Written by Callum Buckley ·
30-day free trial. No credit card needed.
What is a signal flow diagram?
A signal flow diagram is a drawing of a system's signal path: sources on the left, processing in the middle, destinations on the right, with every connection shown. It is the drawing you fault-find from, and the one the install crew wires from.
It differs from a floor plan, which shows where things sit, and from a rack elevation, which shows how they are mounted. Patchify keeps all three in one project, built from the same devices.
What goes on an audio signal flow chart?
Every source, every input it lands on, and every output that leaves the console. For live sound that means the stage inputs, the stagebox, the console, the processing and the amplifiers, plus the separate path for monitors. Here is a small band system drawn in Patchify:
| Path | Chain | Cable |
|---|---|---|
| Vocals and instruments | Mics and DIs → stagebox inputs → console (over the stagebox link) | Mic cable, XLR |
| Front of house | Console L/R outputs → speaker processor → amplifier → main speakers | XLR, then speaker cable on NL4 |
| Wedge monitors | Console aux sends → stagebox outputs → powered wedges | XLR |
| In-ear monitors | Console aux sends → IEM transmitters → beltpacks (radio) | XLR, then RF |
| Recording | Console USB or Dante → recording laptop | USB or Cat6 |
The stagebox link is drawn as one cable with its own signal type (AES50, dSnake, Dante and others are in the library), so the diagram shows what the network carries without drawing 32 lines.
How do you draw a video signal flow?
Start from the cameras and work towards the outputs: switcher, then record, stream and screens. Mark where the format changes, because that is where converters go. A three-camera stream looks like this:
- Three cameras send SDI to the switcher inputs. Lengths over the cable's rated run need a different cable or a fibre converter; the free SDI cable length calculator gives the limits.
- The switcher's programme output goes to a recorder over SDI and to a streaming encoder over HDMI, so an SDI-to-HDMI converter sits between them.
- The multiview output feeds a monitor on the operator's desk.
- The encoder sends the stream out over Ethernet. Use the streaming bitrate calculator to check the upload.
How do I show Dante, NDI and SDI on one diagram?
Draw each as its own signal type on the port, not as a generic network line. Patchify treats Dante, AES67, NDI, SMPTE ST 2110, SRT and plain Ethernet as separate signals, each with its own colour, so a hybrid meeting room reads at a glance:
| Link | Signal | Connector |
|---|---|---|
| Ceiling mic array → DSP | Dante | RJ45 (PoE) |
| DSP → room PC (USB audio) | USB | USB |
| PTZ camera → room PC | NDI | RJ45 |
| Room PC → display | HDMI | HDMI |
| Lectern laptop → switcher | HDMI | HDMI over HDBaseT |
For larger Dante systems, the Dante network diagram page covers switches, VLANs and redundant networks.
Can I check connector and signal compatibility?
Yes. Patchify only lets you join ports whose signals can actually connect, so an HDMI output won't land on a mic input by accident. When an adapter makes a link valid, such as SDI into an HDMI input through a converter, switch on View > Allow Incompatible to allow it.
How do I turn the diagram into a patch list?
You don't retype it. The project report's Connections tab lists every cable with its number, source port, destination port and signal, sorted or searched however you need. The cable schedule, cable labels and loom lists export to Excel and CSV on paid plans.
If you want to start from a spreadsheet, the free cable schedule template uses the same columns as Patchify's export.
See how racks link back to the diagram: rack diagram softwareQuestions
Is a signal flow diagram the same as a block diagram?
Close. A block diagram shows the main parts of a system; a signal flow diagram adds every connection and its direction. Patchify drawings are the second kind, because each cable is a real port-to-port link.
Can I group the drawing by room or area?
Yes. Zones group devices into rooms or areas on the canvas, and the cable schedule groups cables by zone. Zones are on the Pro plan and up.
Can I draw devices that aren't in the library?
Yes. Build custom gear with your own ports and reuse it in every project. Custom gear needs a paid plan.
How do I share a drawing with someone who has no account?
Send a view-only share link. They open the live diagram in a browser, and you can add a password.
Try it on your next job
Draw the system once and get the cable schedule, rack and PDF pack from the same project.